最新消息 活動預告
4月 2022
(星期四)
How to Find the Stocks whose Prices Move Closely together? (21 Apr 22)
- 相關學科
- 金融科技及金融分析
感謝各位熱烈參與!
以上活動經已圓滿結束,敬請密切留意學院稍後活動。
活動重温
- 日期及時間
- 2022年4月21日 (星期四)17:00 - 17:30
- 地點
- Zoom Webinar
- 費用
- 免費
Mr Danny W. C. Chan
Mr. Chan, FRM, has possessed rich experience in financial risk management, information technology and data science and worked as IT Manager over a decade. Being a practitioner in information technology, he is currently a consultant and trainer at Big Data Consultancy Services Company. Also, he is strong in Cloud-based solutions, Big Data Technology, Data Mining and Machine Learning. Moreover, Mr. Chan has obtained a Bachelor Degree in Mathematics from The Chinese University of Hong Kong as well as three Master Degrees in Risk Management Science from The Chinese University of Hong Kong, Quantitative Analysis for Business from City University of Hong Kong and Industrial Logistics Systems from The Hong Kong Polytechnic University.
- 查詢
- 2867 8331 (finedec@hkuspace.hku.hk)
- 相關課程
- 更多相關課程

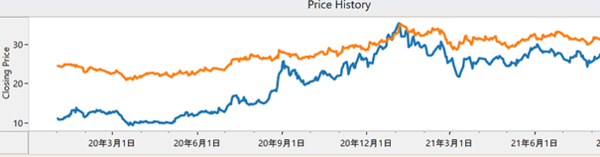
The above diagram depicts the price movement of a pair of stocks that seems to be moving closely together.
The questions are:
1. How can we pick such a pair of stocks easily?
2. What measure should we use to quantify their co-movement?
3. Can we calculate the measure with Excel?
4. With the same technique, can we find stocks that are likely to run in opposite directions?
5. How can we apply such a technique on other business applications?
If you find the above questions inspirational or interesting, why not register for this webinar to understand how you find a relationship with data?
You will find this webinar a worthy one. Don’t miss it.
Language: Cantonese (Supplemented with English)


