What's Happening Events
Dec 2022
(Wed)
How to find a Pair of Stock whose Prices Moved Together? (14 Dec 22)
- Subject
- FinTech and Financial Analytics
Thanks for your participation!
The above event has been completed successfully. Please look forward to the upcoming events.
Want to read more about the event recap?
- Date & time
- 14Dec 2022 (Wed)13:00 - 13:45
- Venue
- Zoom Webinar
- Fee
- Free
- Speaker
-
- Mr Danny W. C. Chan
Mr Danny W. C. Chan
Mr. Chan, FRM, has possessed rich experience in financial risk management, information technology and data science and worked as IT Manager over a decade. Being a practitioner in information technology, he is currently a consultant and trainer at Big Data Consultancy Services Company. Also, he is strong in Cloud-based solutions, Big Data Technology, Data Mining and Machine Learning. Moreover, Mr. Chan has obtained a Bachelor Degree in Mathematics from The Chinese University of Hong Kong as well as three Master Degrees in Risk Management Science from The Chinese University of Hong Kong, Quantitative Analysis for Business from City University of Hong Kong and Industrial Logistics Systems from The Hong Kong Polytechnic University.
- Enquiry
- 2867 8331 (finedec@hkuspace.hku.hk)
- Relevant Programmes
- moreRelevant Programmes

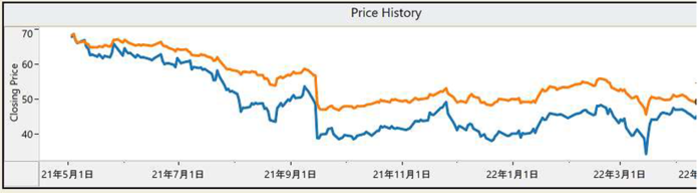
Why would we want to find out a pair of stocks whose prices were moving together?
If you are able to achieve this, you can find a pair of stocks, say A and B, whose prices will probably move in the same direction in the near future.
With a similar technique, if you shift the timeline of stock B by one day, you will be likely to have found another pair, say stock C and D such that when C goes up, D would be rising in the next trading day.
How well would you get the result? That is needless to tell.
What about conversely we want to find a stock pair whose prices were moving in an opposite direction? How would we benefit from the finding then?
This is a fresh idea of technical analysis about stock prices. In this talk (webinar), the speaker will showcase part of this idea with the technique of data visualization.
You are advised not to miss this opportunity as you will find it a worthy knowledge sharing session on stock price analytics.
Sample Screenshots below:
Language: Cantonese (Supplemented with English)


