What's Happening Events
Apr 2023
(Mon)
How to Design Stock Price Analytics System with a BI Solution? (Part 1) (17 Apr 23)
- Subject
- FinTech and Financial Analytics
Thanks for your participation!
The above event has been completed successfully. Please look forward to the upcoming events.
Want to read more about the event recap?
- Date & time
- 17Apr 2023 (Mon)13:00 - 13:45
- Venue
- Zoom Webinar
- Fee
- Free
- Speaker
-
- Mr Danny W. C. Chan
Mr Danny W. C. Chan
Mr. Chan, FRM, has possessed rich experience in financial risk management, information technology and data science and worked as IT Manager over a decade. Being a practitioner in information technology, he is currently a consultant and trainer at Big Data Consultancy Services Company. Also, he is strong in Cloud-based solutions, Big Data Technology, Data Mining and Machine Learning. Moreover, Mr. Chan has obtained a Bachelor Degree in Mathematics from The Chinese University of Hong Kong as well as three Master Degrees in Risk Management Science from The Chinese University of Hong Kong, Quantitative Analysis for Business from City University of Hong Kong and Industrial Logistics Systems from The Hong Kong Polytechnic University.
- Enquiry
- 2867 8331 (finedec@hkuspace.hku.hk)
- Relevant Programmes
- moreRelevant Programmes
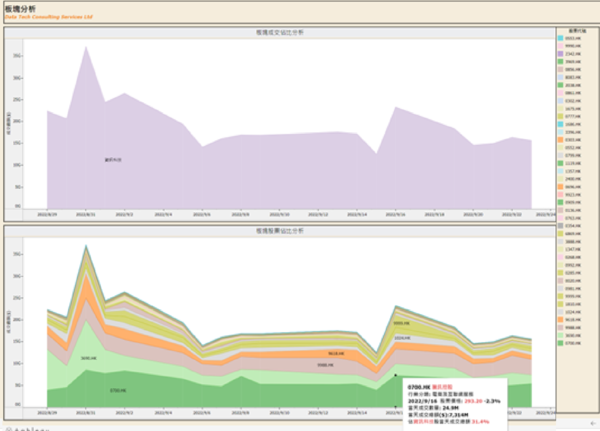
To design a stock price analytics system, we need to do the following:
1. Collect historical stock prices
2. Transform the collected stock price record to an appropriate format for presentation
3. Present the transformed stock price datasets in a useful layout to facilitate analytics and investors’ review.
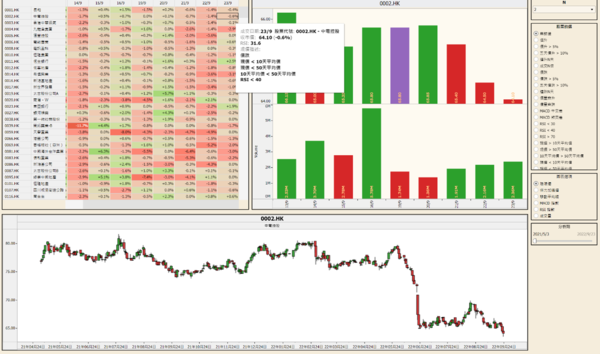
In this talk (webinar), the speaker will showcase how to design an analytics system for Hong Kong Stocks with a BI approach. This would give you a fresh view of the practical use of data automation and data visualization techniques.
During this webinar, you will explore how a stock price analytics system will help you to:
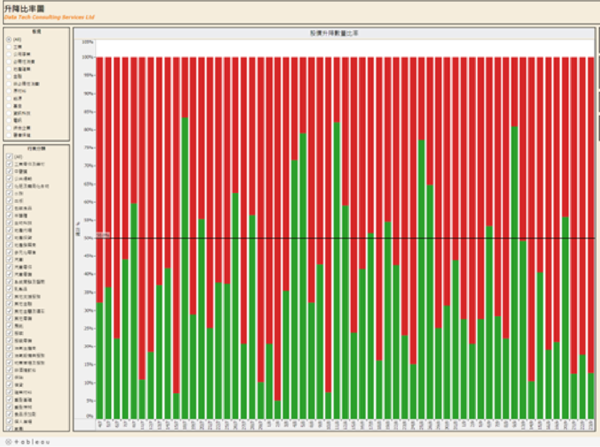
1. Visualize the macro trend of the stock market performance (i.e. whether the stock market is bull or bear)
2. Identify if a stock market sector performance is improving or not
3. Select stocks that that recently performance well or worse
4. Identify stocks that are oversold or overbought
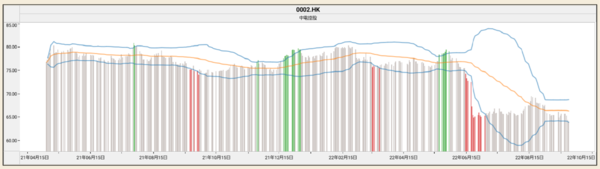
5. Visualize stock price trend with a candlestick chart, Bollinger Band Chart, etc.
This is an advanced application of data visualization techniques with common financial data. You will find this webinar inspiring and will give you food for thought on how to make use of learnt data techniques for financial use.
Language: Cantonese (Supplemented with English)


