What's Happening Events
Jul 2023
(Wed)
How to Design a Dashboard for Bank CEOs? (5 Jul)
- Subject
- FinTech and Financial Analytics
Thanks for your participation!
The above event has been completed successfully. Please look forward to the upcoming events.
Want to read more about the event recap?
- Date & time
- 05Jul 2023 (Wed)13:00 - 13:45
- Fee
- Free
- Speaker
-
- Mr Danny W. C. Chan
Mr Danny W. C. Chan
Mr. Chan, FRM, has possessed rich experience in financial risk management, information technology and data science and worked as IT Manager over a decade. Being a practitioner in information technology, he is currently a consultant and trainer at Big Data Consultancy Services Company. Also, he is strong in Cloud-based solutions, Big Data Technology, Data Mining and Machine Learning. Moreover, Mr. Chan has obtained a Bachelor Degree in Mathematics from The Chinese University of Hong Kong as well as three Master Degrees in Risk Management Science from The Chinese University of Hong Kong, Quantitative Analysis for Business from City University of Hong Kong and Industrial Logistics Systems from The Hong Kong Polytechnic University.
- Enquiry
- 2867 8331 (finedec@hkuspace.hku.hk)
- Relevant Programmes
- moreRelevant Programmes
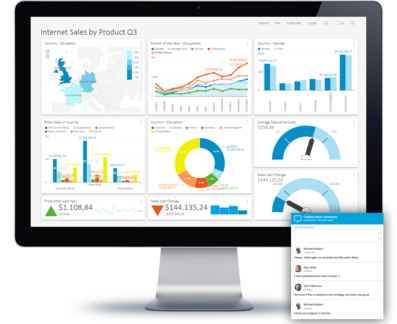
Dashboards for Bank CEOs need to enable the bank executives to review the business of the bank effectively and to facilitate the users to get business insight in an easy manner. Management people would like to monitor business operations with an exception analysis that sticks out the cases of outliers relative to the normal ones. This is called management by exceptions.
What’s more, it prefixes to design such a dashboard in a flexible way in that the bank CEO would be able to see charts with their own choice of dimensions and measures on the fly.
As data is a flow concept, all executives would like to see the trend of the flow data in an effective way. Have you ever thought of reviewing data with animation instead of merely showing the trend with a traditional line chart? That sounds superb and crazy, but you will come across one in the webinar.
If you are interested in learning how I designed a powerful dashboard for the CEO, starting from the data preparation, why don’t you register for this webinar with the link below?
Language: Cantonese (Supplemented with English)


